
A nifty Scenegraph library for canvas 2d html rendering.
 tentone
6b901b2989
Get value method
tentone
6b901b2989
Get value method
|
hace 5 años | |
|---|---|---|
| build | hace 5 años | |
| docs | hace 6 años | |
| examples | hace 5 años | |
| readme | hace 6 años | |
| source | hace 5 años | |
| .gitignore | hace 5 años | |
| LICENSE | hace 6 años | |
| README.md | hace 5 años | |
| _config.yml | hace 6 años | |
| package.json | hace 5 años | |
| rollup.config.js | hace 6 años | |
| rollup.dev.js | hace 5 años |
README.md
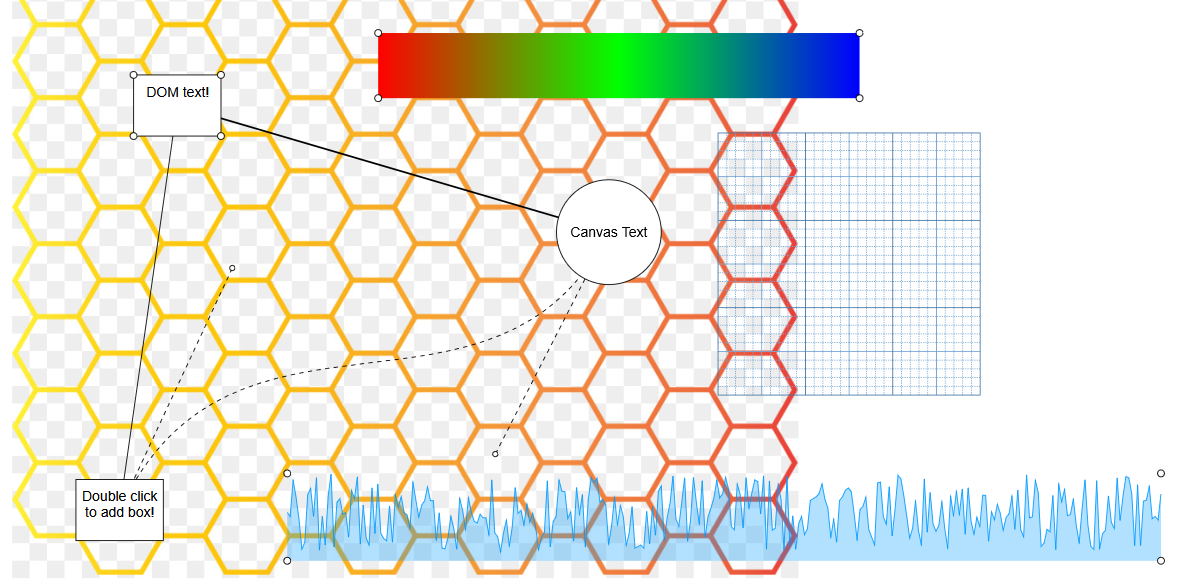
escher.js
![]()
- Web based 2D graph building framework.
- Entity based diagram build system, entities are stores as a tree. Parent elements transformations affect the children transforms.
- Boxes, circle, custom shapes, lines, customizable elements.
- Support for DOM elements using CSS transforms (useful for text input, or more complex user interaction).
- Built in viewport controls with drag, zoom and move functions.
- Supports mobile web browsers.
Getting started
- There are a couple of example in the example folder, they can be used as base for your project.
- There is also available API documentation containing implementation details about all the internal components of the framework and detailed functionality descriptions.
Setup
- Add the library to your project by using the precompiled file availabe on the repository or by downloading it from NPM.
- Escher is based on web canvas, it requires a DOM canvas element to draw its content.
- It is necessary for the canvas element width and height parameters to be properly configured since their values are used to process user input.
- When using other DOM elements with the framework is also necessary to setup a DOM div to store these elements. (Booth the canvas and division should have the same position and size and should be aligned).
The code bellow shows how a canvas could be configured for a full screen setup.
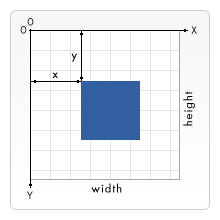
var canvas = document.createElement("canvas");
canvas.style.width = "100%";
canvas.style.height = "100%";
canvas.style.top = "0px";
canvas.style.left = "0px";
canvas.style.position = "absolute";
canvas.width = window.innerWidth;
canvas.height = window.innerHeight;
document.body.appendChild(canvas);

document.body.onresize = function()
{
canvas.width = window.innerWidth;
canvas.height = window.innerHeight;
};
The coordinate system used, is the same as if using the canvas API directly -Y is down relative to the origin and +X is left relative to the origin. All objects are positioned using this coordinate system.
Viewport
- The viewport is the object that indicates how the user will view the objects, the viewport can be used to change the position of the elements, zoom in and out, or even rotate the entire canvas.
- Some object might ignore the viewport transformations by setting the
ignoreViewportflag to false, this will indicate that renderer to reset the viewport transform just for that object. - Its possible to use viewport controller objects that define a default control behavior for the viewport object (mouse interaction).
Custom Objects
- Its possible to create custom graph elements by expanding the Object2D class, and overriding its
draw(context, viewport, canvas)and itstransform(context, viewport, canvas)methods. - The
draw(context, viewport, canvas)function is where the object gets draw into the screen, here you can implement your custom object as if it was drawn alone in a canvas. - The
transform(context, viewport, canvas)is where the object matrix gets applied to the canvas drawing context, it is assumed that the viewport transformation was pre-applied. - Consider the point zero the origin of the object, every object has a position, rotation, scale and origin points used to control the object transform, these points don't need to be considered in the draw method.
Example of a custom element, drawing a custom box with a red gradient box. Its also possible to extend other base objects like
Boxthat already includes the necessary code for mouse events.var object = new Escher.Object2D(); object.draw = function(context, viewport, canvas) { // Create gradient var grd = context.createLinearGradient(0, 0, 70, 0); grd.addColorStop(0, "#FF0000"); grd.addColorStop(1, "#FFFFFF"); // Fill with gradient context.fillStyle = grd; context.fillRect(-70, 70, 140, 140); };
Pointer events
The system supports multiple pointer events that can be used to control the objects and interact with the users.
// Called when the pointer enters the object.
onPointerEnter(pointer, viewport);

// Called when the was inside of the object and leaves the object.
onPointerLeave(pointer, viewport);

// Called while the pointer is over (inside) of the object.
onPointerOver(pointer, viewport);

// Called when the object is dragged across the screen, only works if the object has the property draggable set true.
// Delta is the movement of the pointer already translated into local object coordinates.
onPointerDrag(pointer, viewport, delta);

// Called while the pointer button is pressed.
onButtonPressed(pointer, viewport);

// Called when the pointer button is pressed down.
onButtonDown(pointer, viewport);

// Called after the pointer button gets released.
onButtonUp(pointer, viewport);
DOM Objects
- Its possible to use DOM elements in the graph, by applying CSS transform to absolute positioned elements the system already provides a DOM base object that creates a basic division.
- DOM objects are always drawn on top of everything else, its not possible to partially occlude a DOM object with a canvas object.
DOM objects contain a div
elementinside that can be used to attach custom code, by default that elementpointerEventsCSS style is set to none, disabling all the pointer events, it can be set to auto to re-enable them.var dom = new Escher.DOM(division); dom.size.set(100, 50); dom.origin.set(50, 25); group.add(dom); // Re-enable DOM pointer events dom.element.style.pointerEvents = "auto"; // Attach a new DOM element to the DOM object var text = document.createElement("div"); text.style.fontFamily = "Arial"; text.style.textAlign = "center"; text.innerHTML = "DOM text!"; dom.element.appendChild(text);
Integrating external libraries
- Its possible to integrate external canvas based libraries with this framework, just be sure that the library provides methods to directly draw to the canvas context without resetting its state.
- Other easier but slower way to integrate libraries that works for libraries that do not support canvas as argument in their draw functions is to copy the content from their own self managed canvas into the object draw method.
Here is an example using the tiff.js library to draw tiff images, it creates an internal canvas ands does not provide a draw into this context method.
// Read the tiff data as arraybuffer from file var xhr = new XMLHttpRequest(); xhr.responseType = "arraybuffer"; xhr.open("GET", "images/kofax.tif"); xhr.onload = function (e) { // Decode the image using tiffjs var tiff = new Tiff({buffer: xhr.response}); var tiffCanvas = tiff.toCanvas(); if(tiffCanvas) { // Create the object to draw var tiffImage = new Escher.Object2D(); tiffImage.draw = function(context, viewport, canvas) { // Copy the content of the tiff canvas context.drawImage(tiffCanvas, 0, 0); }; // Add object to the group group.add(tiffImage); } }; xhr.send();- Some libraries provide
ImageData, thecontext.putImageData()method does not consider the canvas transforms. To drawImageDatainto the canvas its possible instead to create a offscreen canvas draw into that canvas and the use thecontext.drawImage()method.
- Some libraries provide
License
- This project is distributed under MIT license available on the repository page.